2.5.1 Creating a Bar Histogram
To create a Bar histogram, first the instructor selects the Visualization tab and then a new window displays how to create visualization as shown in figure 2.5.14.
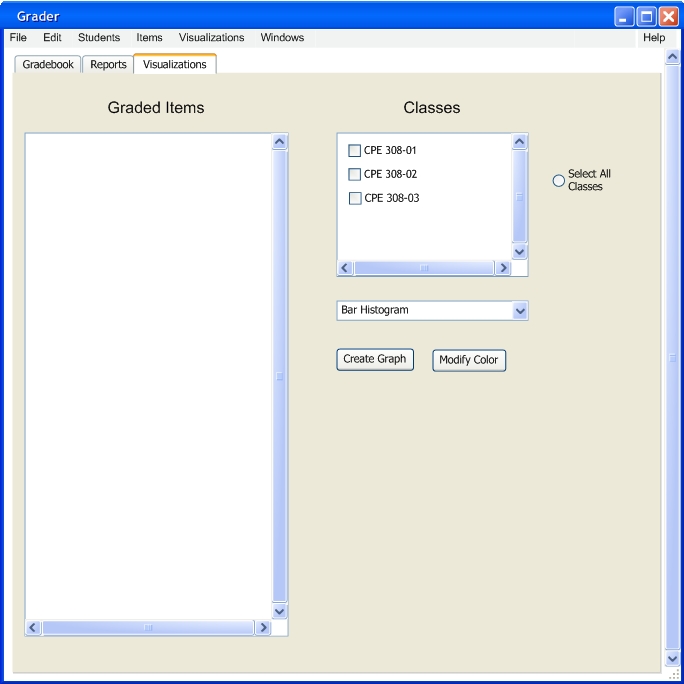
FIGURE 2.5.14
The user selects Bar Histogram in the drop down menu. At the top the user selects the class CPE 308-01 so the items can be displayed as shown by figure 2.5.15.
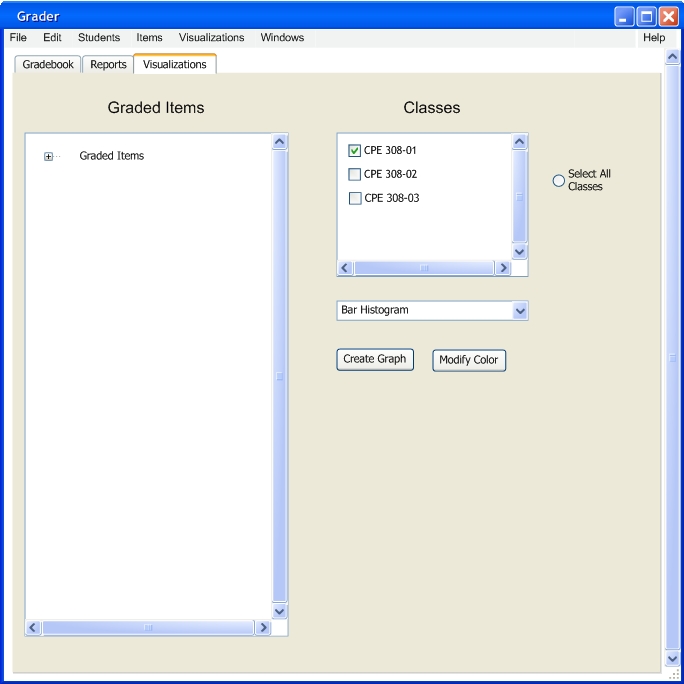
FIGURE 2.5.15
Now at this picture here, the items tree node has shown. The user selects the button Create Graph. Selecting this button without selecting an item will default to the class grades instead of a Graded Item as shown by figure 2.5.16.
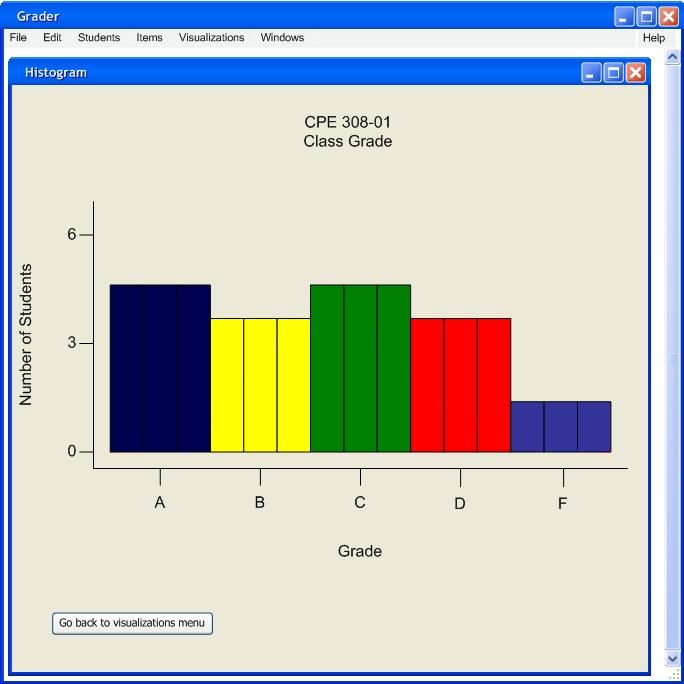
FIGURE 2.5.16
Now to modify the grades on the graph, the user must select a line. A line becomes selectable when it turns white as shown by figure 2.5.17.
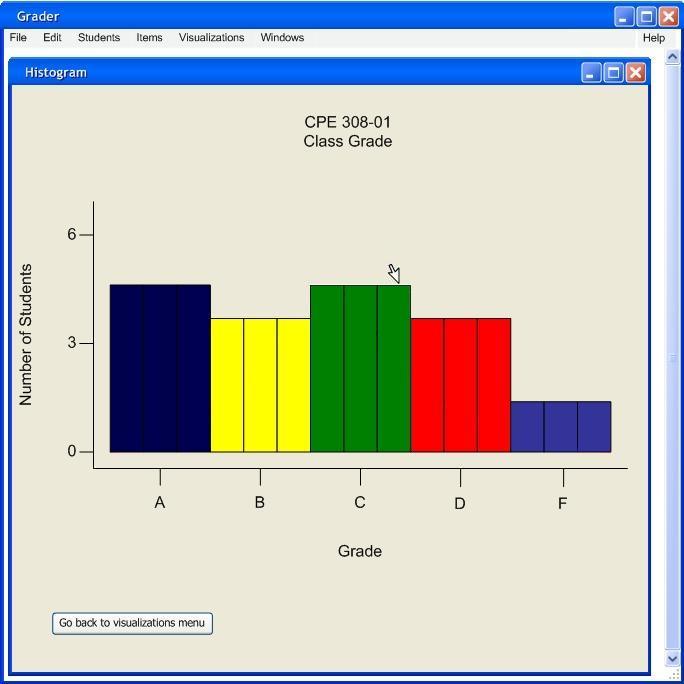
FIGURE 2.5.17
The user selects the line currently selected and moves it up once add more C’s as shown by figure 2.5.18
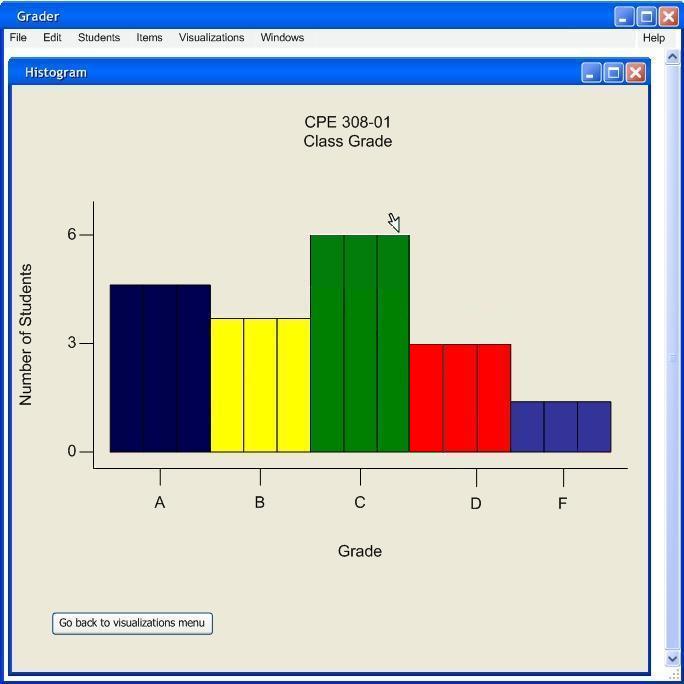
FIGURE 2.5.18
Here is a picture of what the gradebook looks like now that the user has modified the bar histogram. The grades changed are outlined in read as shown in figure 2.5.19.
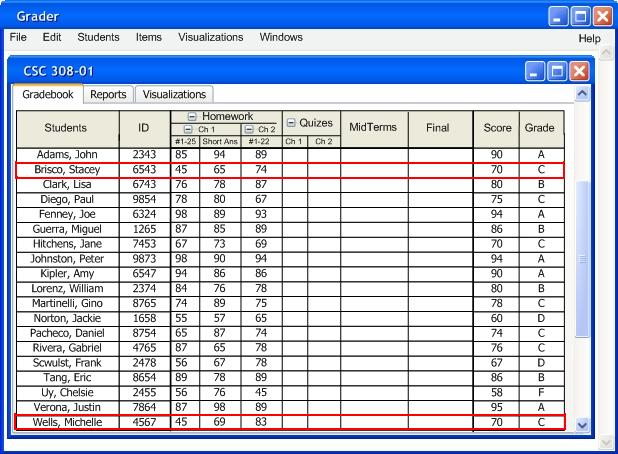
Figure 2.5.19
Now let the user make another bar histogram using the +/- grade scale that was built in 2.4.2. The user can reach the grade scale by pressing the modify button. After the user has done this press the button create a graph to see the graph with the new grade scale as shown in figure 2.5.19.
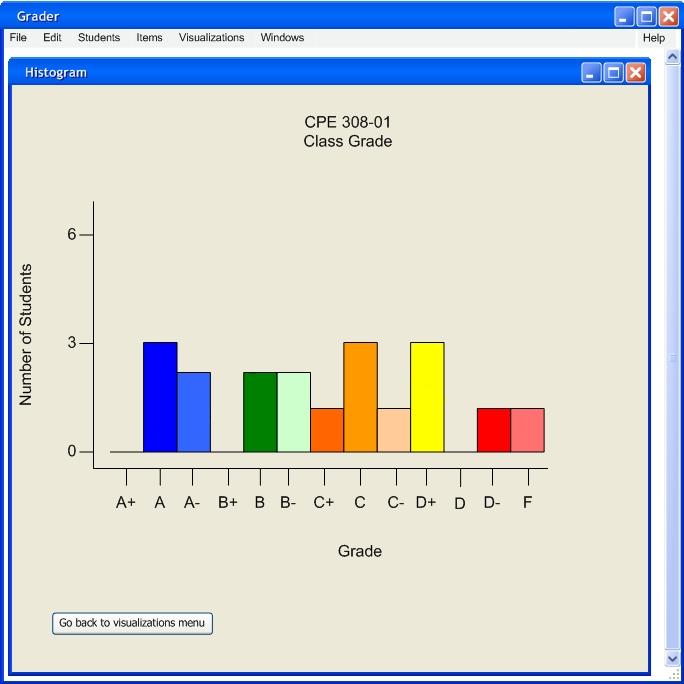
Figure 2.5.20
Now to modify the bar histogram, place the mouse over the bar you want to modify and either push up or down. Let the user put the cursor over B+ and push up so we can have a B+ student in the class as shown in figure 2.5.21.
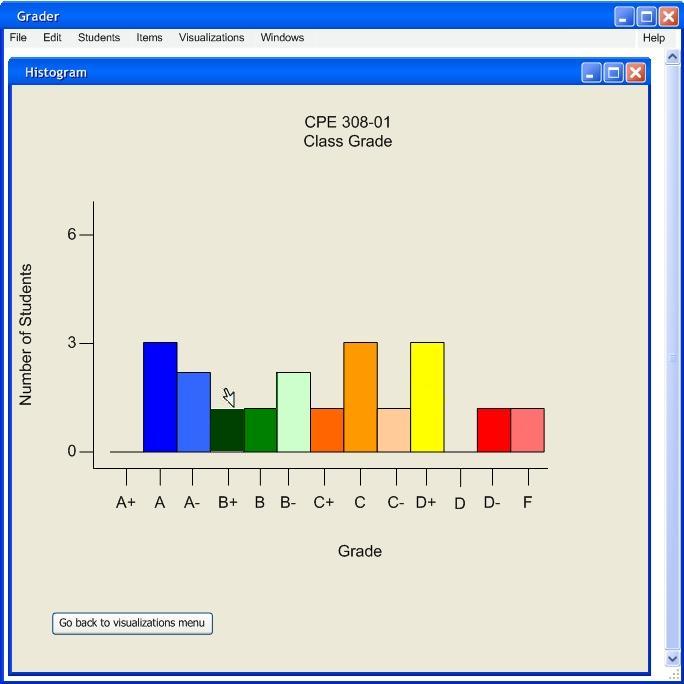
Figure 2.5.21
Now this is what the grade sheet looks like if the user added a B+ to the gradebook as shown by figure 2.5.22.
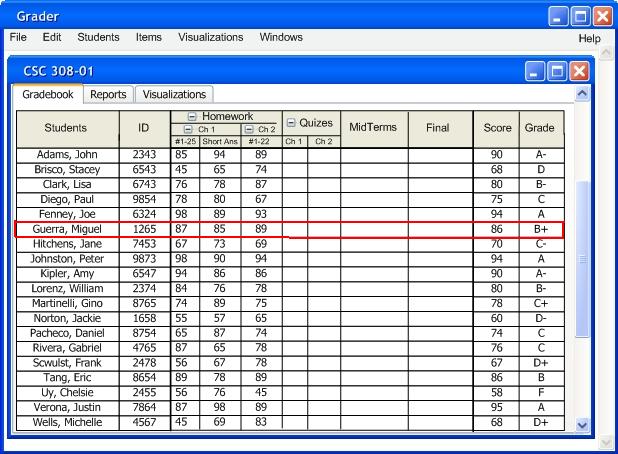
Figure 2.5.22
Prev: 2.5 Create a Visualization | Next: 2.5.2 Create a Pie Chart| Up: Functional | Top: Index