2.5.4 Creating a Visualization for Multiple Classes
To create visualizations, first the instructor selects the Visualization tab and then a new window displays how to create visualization as shown in Figure 2.5.41.
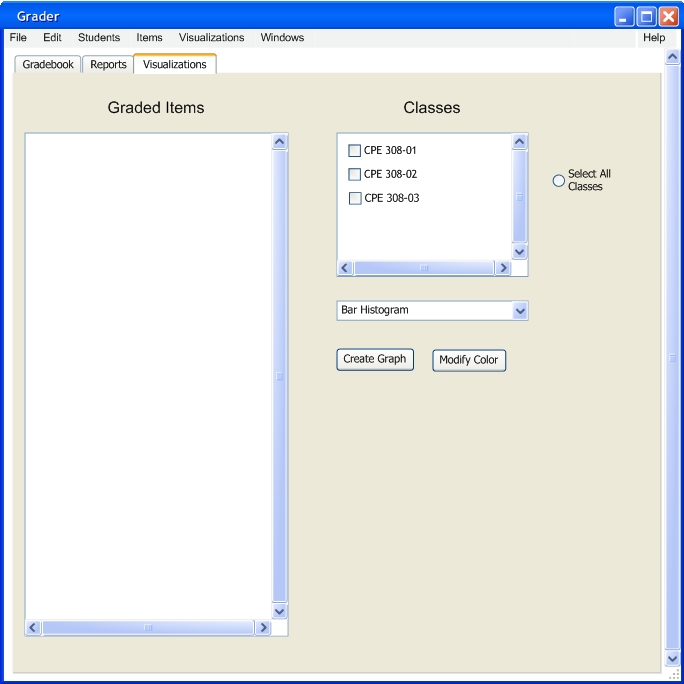
FIGURE 2.5.41
In figure 2.5.41 the user selects the Select All Classes radio button. This will select all the classes. Also we are going to use a Bar Histogram to display this visualization.
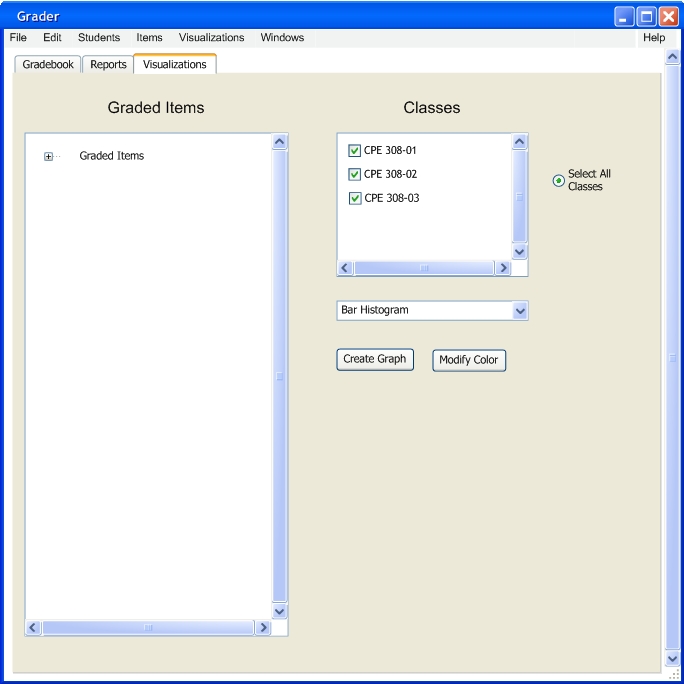
FIGURE 2.5.41
Now in figure 2.5.42, the user creates a graph by clicking the Create Graph button.
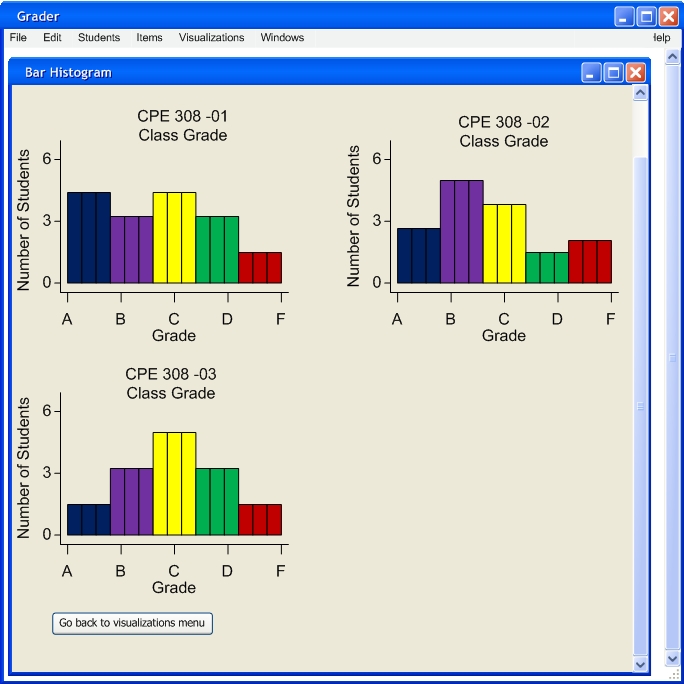
FIGURE 2.5.42
Prev: 2.7.3 Create a Dot Plot | Next: 2.6 Print a Report| Up: Functional | Top: Index