2.4.5 Statistics
The instructor can view statistics for a class in two ways: it can appear at the bottom of the gradebook for that class or it can be in its own window. In the gradebook, statistics including average, median, standard deviation, and range will be each of their own rows and their data will be calculated for each of the columns as seen in figure 2.6.1.
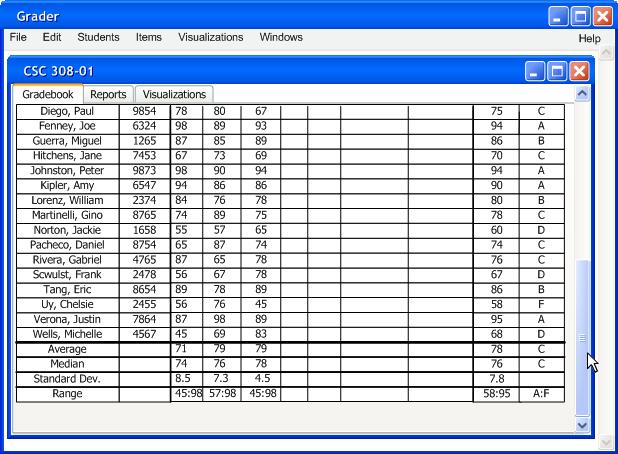
Figure 2.6.1
Grades can be shown in the gradebook by selecting the Window > Show Statistics > In gradebook command. To show this information in a separate window select Window > Show Statistics > In Window, then the dialog in figure 2.6.2 appears.
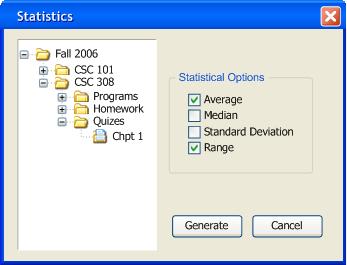
Figure 2.6.2
This dialog box allows the instructor to choose the data from which the statistics are calculated. He or she can select any folder or document in the hierarchy. Choosing a folder would include all of its subfolders and documents in the statistics. The instructor can also select multiple documents. In addition the user can choose which statistics he or she would like to see. Selecting the Generate Button would result in figure 2.6.3.
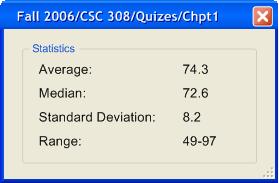
Figure 2.6.3
The statistics box will show the data it represents in its title. (This example shows what the user would see if he or she selected all the options.)