Figure 57: Selecting items to graph.
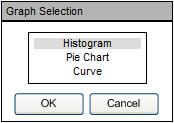
Figure 58: Graph selection.
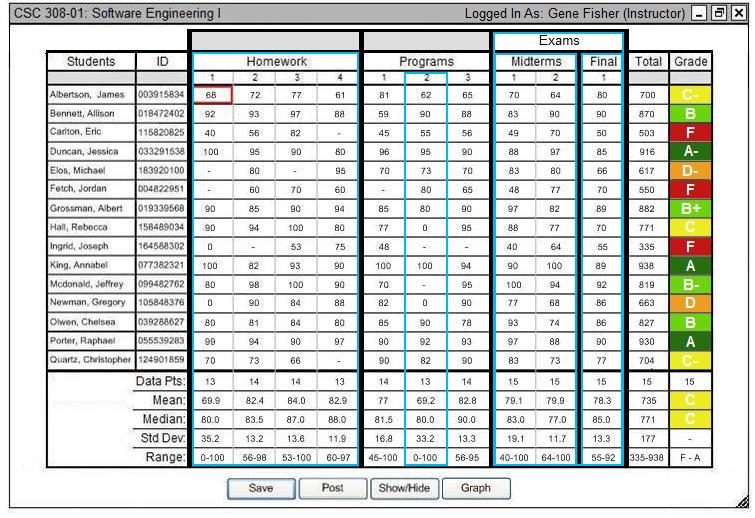
This scenario shows how to take the grade sheet scores and visualize them into a graph.
The instructor clicks "Graph", as seen on this figure, to choose which type of graph to use for the selected data. The data that appears on the graph depends on which items the instructor chooses before clicking on "Graph". To choose an item, the instructor simply clicks on the item's border which highlights the entire section. The instructor can also select multiple items to graph by holding down CTRL while clicking. The figures below show a combination of possible selected items and the graph type selection window.
|
Figure 57: Selecting items to graph. |
Figure 58: Graph selection. |