|
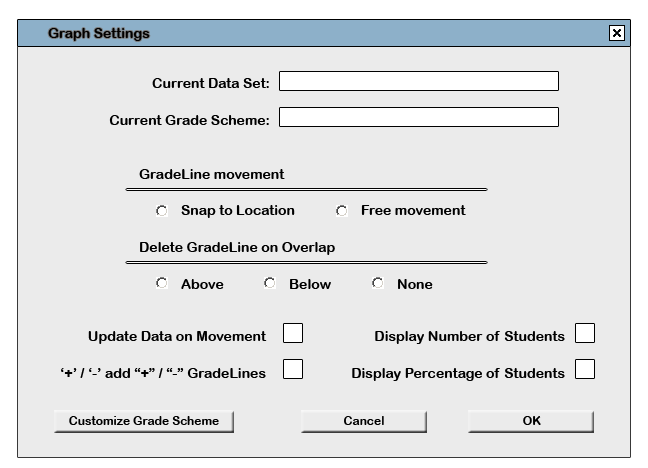
| Figure 78: Graph Settings |
On all graphs, users can change the data set that is currently being displayed at any time. They can do the following by right-clicking the graph that they have open and selecting Adjust Settings from the right-click menu that appears. The following prompt will appear:

|
| Figure 78: Graph Settings |
In this dialogue, users can click on the box next to Current Data Set, which will have the name of their data set displayed while a graph is active. This will result in a drop-down menu of all the items on the gradesheet in hierarchical form.
There are several other settings here as well.
Current Grade Scheme: Users can adjust the Grade Scheme they are currently using for the graph and the item by clicking on the box and selecting from preset or saved Grade Schemes.
GradeLine movement: Users can either choose to have the adjustable gradeline automatically snap to each next valid location or move freeform.
Delete GradeLine on Overlap: Users can choose to enable deleting gradelines using the overlap function or turn it off.
Selecting Above will delete the gradeline the user currently has control of when it overlaps another gradeline.
Selecting Below will delete the gradeline that a user overlaps with the gradeline the user currently has control of.
Update Data on Movement: Users can enable real-time update of grades and data on all aspects of the gradesheet, rather than clicking an Apply button.
'+' / '-' add "+" / "-" GradeLines: Users can select this to allow adding a "+" or "-" grade upon pushing the '+' or '-' key on their keyboard while a gradeline is selected.
Display Number of Students: On the Histogram and PieChart, the number of students is displayed in each grade category. Users can choose to turn this on or off.
Display Percentage of Students: On the Histogram and PieChart, the percentage of students is displayed in each grade category. Users can choose to turn this on or off.
GoTo: