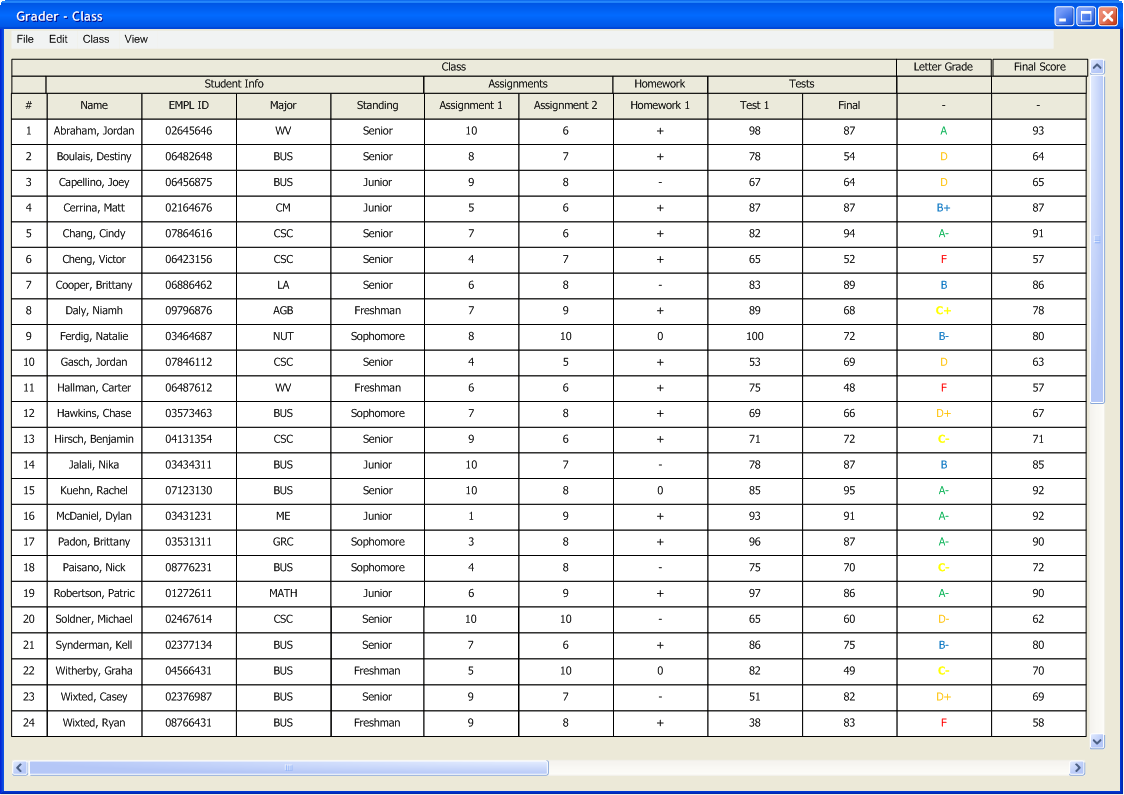
Figure 2.2.4a: Gradebook Before Changing the Final Grade Distribution
The final grade distribution determines the percentages of points that awards
a student a certain grade mark. This is fully customizable allowing the user
to select any string and color to be displayed for different tiers of grades.
This scenario assumes that a class is currently open, as described in 2.2 Basic Gradebook Setup. The gradebook looks like Figure 2.2.4a.
The Final Grade Distribution dialog window is opened by selecting Class -> Final Grade Distribution. Figure 2.2.4b shows the initial window the first time it is opened.
Since this is the first time the window has been opened for this gradebook, some fields are filled in with the default values shown. After the user clears the fields, the dialog looks like Figure 2.2.4c.
The user inputted A as the symbol and chose Green as the color (Figure 2.2.4d). The lower bound field determines the lowest value that still constitutes as that final grade. This is used along with the lower bound of the grade above it to set the range of percentages for the given grade. Figure 2.2.4e shows a completed final grade distribution. In this example, the professor removed +'s and -'s from the final grade distribution.
The final grade distribution can be editted at any time and these changes will be reflected in the Pie Chart and Histogram and vice versa. The final grade shown in the gradebook is also updated, as shown below in Figure 2.2.4f.