Another way to set curves in the Grader is by using a graphical interface to visually see how each category is weighted. The professor clicks on set curve and this window pops up.
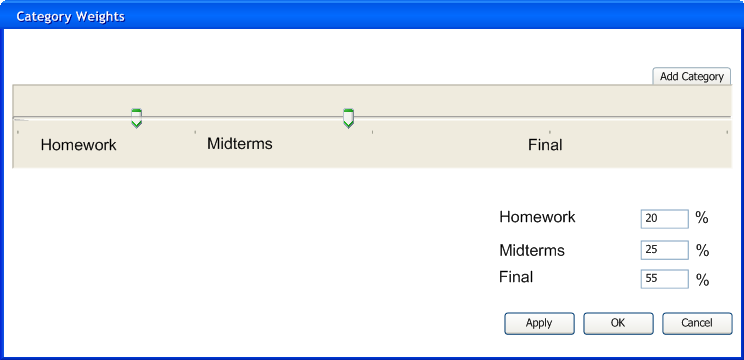
Here there are slider markers which can be adjusted for each category. The weights get updated immediately in the lower-right hand corner to see instantly the result of the adjustments. The slider of the last category in the list is always at the very right to set a bound for the end. The curves can be updated via the sliders or by typing in the text boxes directly.
The first and easiest option is to use the sliders. By sliding the category markers around, the curve is adjusted and the lower-right text boxes are updated.
The other option is to type into the text boxes (making sure they add up to 100%) and clicking apply. The sliders will be updated.
The professor either slides the Homework category 7 points to the left, or enters new percentages in the text boxes and clicks apply.
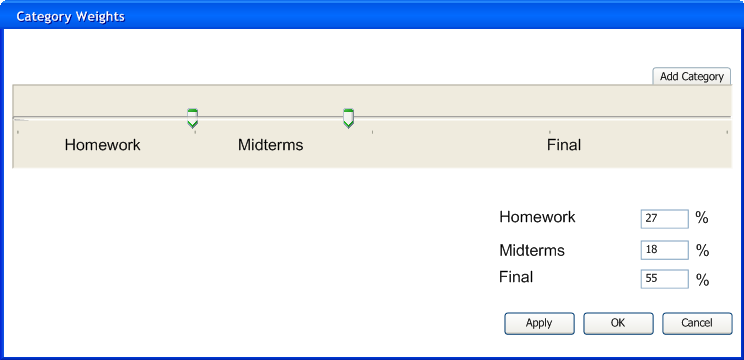
The curves have been updated in the text boxes and the sliders.
The curves of the graded items within a category can also be adjusted in the same manner by double-clicking the category name. The professor double-clicks Homework.
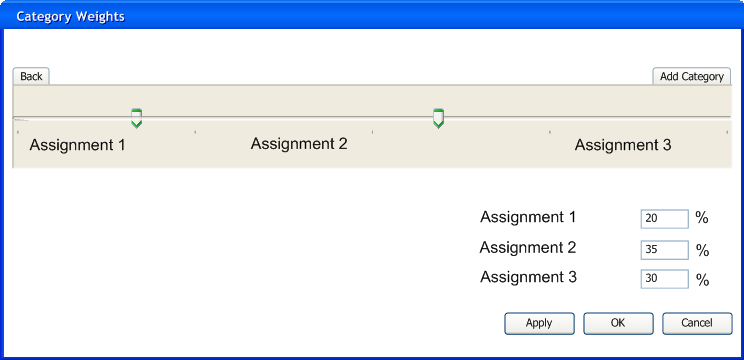
The Homework's graded items curves function exactly the same as adjusting the curves of the upper level categories.
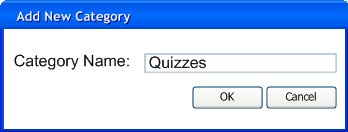
Another way to add categories is through this window. The professor clicks on the Add Category button at the top right and the Add Category window pops up. It takes a name, a string.
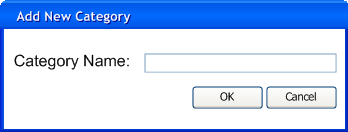
The professor types in the name "Quizzes" and clicks OK.
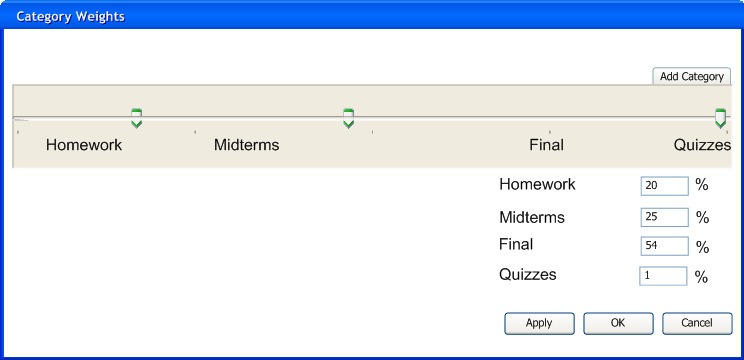
The Quizzes category was added at the far right so that all the weights will be set relative to it now..