
| Requirements | Specification | Prototype | Design | Implementation | Testing | Administration | Documentation |
|
|||||||||
|
2.4 Viewing
The scenarios in this section shows a user viewing the gradebook in varies
ways. Including:
2.4.1 Interactive graphs
The Grader can automatically compile and graph the scores of the selected
item. The graphs will be displayed in a separate window for
viewing. Details on each type of graphs will be explained in the
sub-sections.
2.4.1.1 Histogram
Users are able to display selected items as histograms. To do so, the
user first needs to select an item by left-click it on the grade book.
The user is able to select multiple items by holding down the ctrl key while
selecting. Next, the user needs to click on the View menu on the
menu-bar and select Plot Histogram. (See Figure 1)
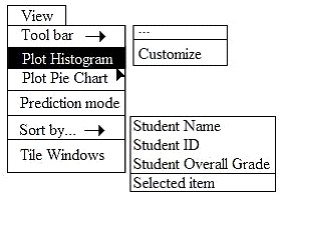
Figure 1
|
The histogram is displayed in a separate window. You can interact with
this histogram in many ways. The graph contains a slide bar, in which
the user is able to drag along to set the grading curve for that item.
Note: This function is disabled for student-users and TA-users.
2.4.1.2 Pie chart
Users are able to display selected items as pie chart. To do so, the
user first needs to select an item by left-click on it. The user is able
to select multiple items by holding down the ctrl key while clicking.
Next, the user needs to click on the View menu on the menu-bar and select Plot
Pie Chart. (See Figure 2)
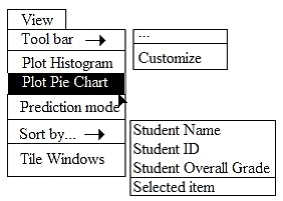
Figure 2
|
The pie chart is displayed in a separate window. You can interact with
this pie chart in many ways. The pie chart contains a sliding handle, in
which the user is able to drag and drop to set the grading curve. The
percentage of each grade categories adjacent to the sliding handle will jump
to display the percentages as the user slide the handle bar. Note: This
function is disabled for student-users and TA-users.
2.4.2 Prediction mode
All users can use this function. Simply go to the View menu on the
menu-bar and select Prediction Mode will switch the viewing screen into
prediction mode. While under the prediction mode, the users are able to
enter a grade letter and the system will automatically predict what score that
the student need to achieve on each of the entered item in order to achieve
that grade in class. The user can also enter a score in an ungraded item
to predict an grade.
2.4.3 Sorting
The Grader can sort students according to each of the column items. The
user can do so by going to the View menu on the menu bar and select 'Sort
by...'. A sub-menu will pop-up and allows you to select different ways
to sort the grade book. The user can sort the grade book by student
name, student ID, student overall grade, team, and individual items. The
user can also do so by right-click on each of the grade book columns and
select 'Sort'.
2.4.4 Multi-tasking windows
The Grader can open multiple class-sections at the same time. The users
are able to arrange these windows neatly on the screen by going to View on the
menu-bar and select 'Arrange Gradebooks'. The Grader automatically tiles
the windows in an orderly fashion.
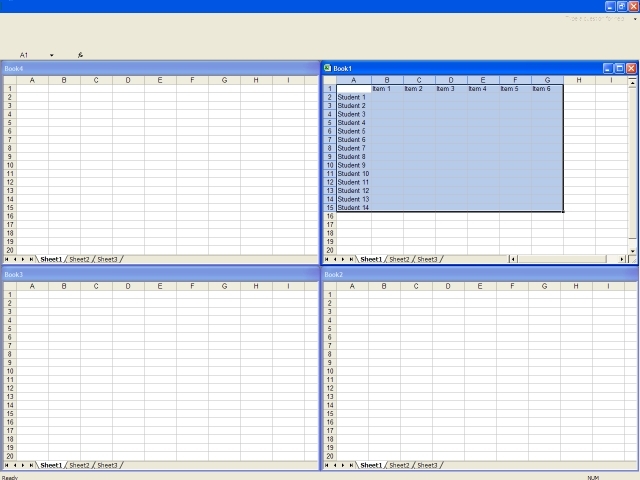 Figure 3 |