2.5.1. Using the Item Explorer Window
This scenario shows how an individual uses the Item Explorer window to select which
columns are shown on the Grade Spreadsheet. In this scenario, we assume that the user
has only the default settings and has already created 15 students (covered in section 2.3.2.),
as well as 3 tests (Midterms: M1 & M2, a Final, and a Quiz) (covered in section 2.4.2.).
To start with, the Item Explorer window has all of the major assignment types for this class:
Tests, Programs, and Labs. The percentage on the right of the assignment
type is the overall class average for that category. The percentage in the spreadsheet is showing each
student's average for that category. The Grade Spreadsheet mirrors the categories
shown in the Item Explorer window, as seen in Figure 2.5.1.1.
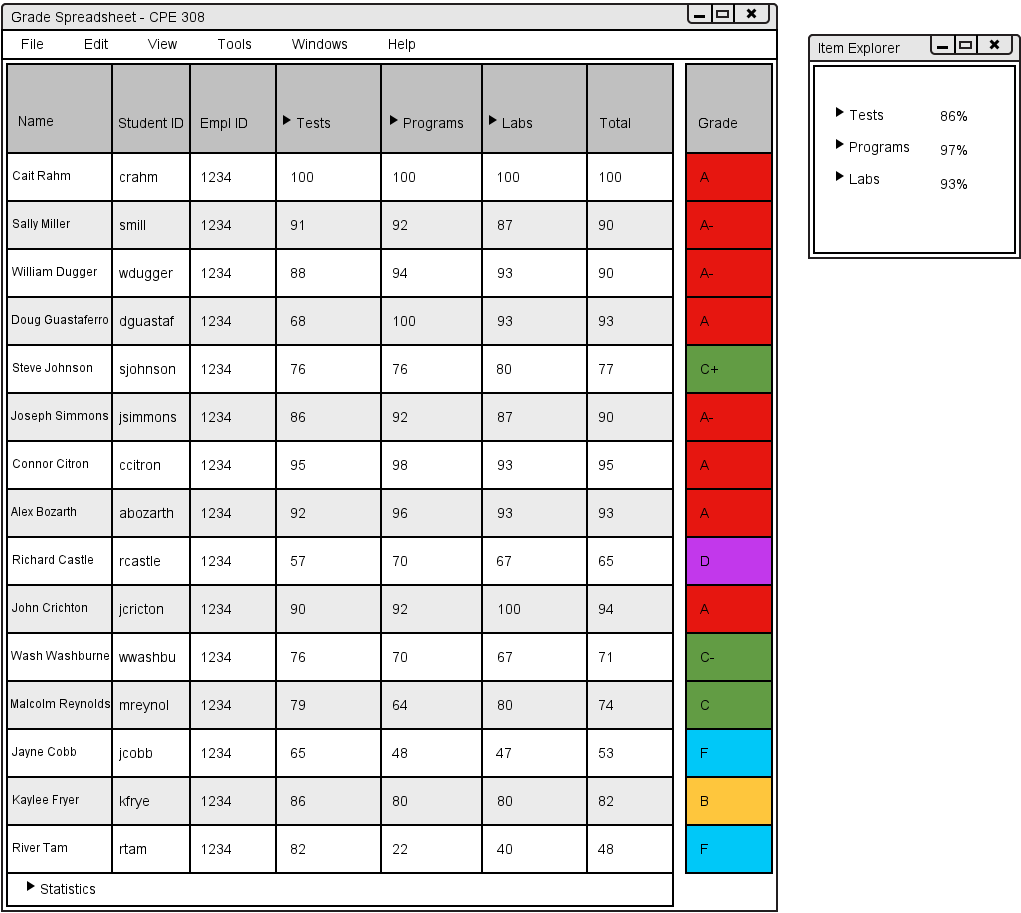
Figure 2.5.1.1: Default view of Item Explorer window/Grade Spreadsheet.
The arrow pointing to the right signifies a category that contains further sub-categories.
Right now, all 3 categories are not opened. Clicking the arrow next to Tests in the Collapse window
or on the Grade Spreadsheet opens the Tests category showing its sub-categories. The Grade Spreadsheet
and Item Explorer window will update together, so clicking the arrow on either will update both.
The arrow next to Tests is now pointing down, which signifies it is showing its
sub-categories. No arrow signifies an assignment. In this case, it
shows the Quizzes sub-category, Midterms sub-category and a test named Final. The percentages in the Quizzes and Midterms
columns are still showing the student's average, while the percentages in the Final column
are showing the student's grade on the test. The overall averages are also shown in the Item Explorer
window.
The updated windows are shown in Figure 2.5.1.2.
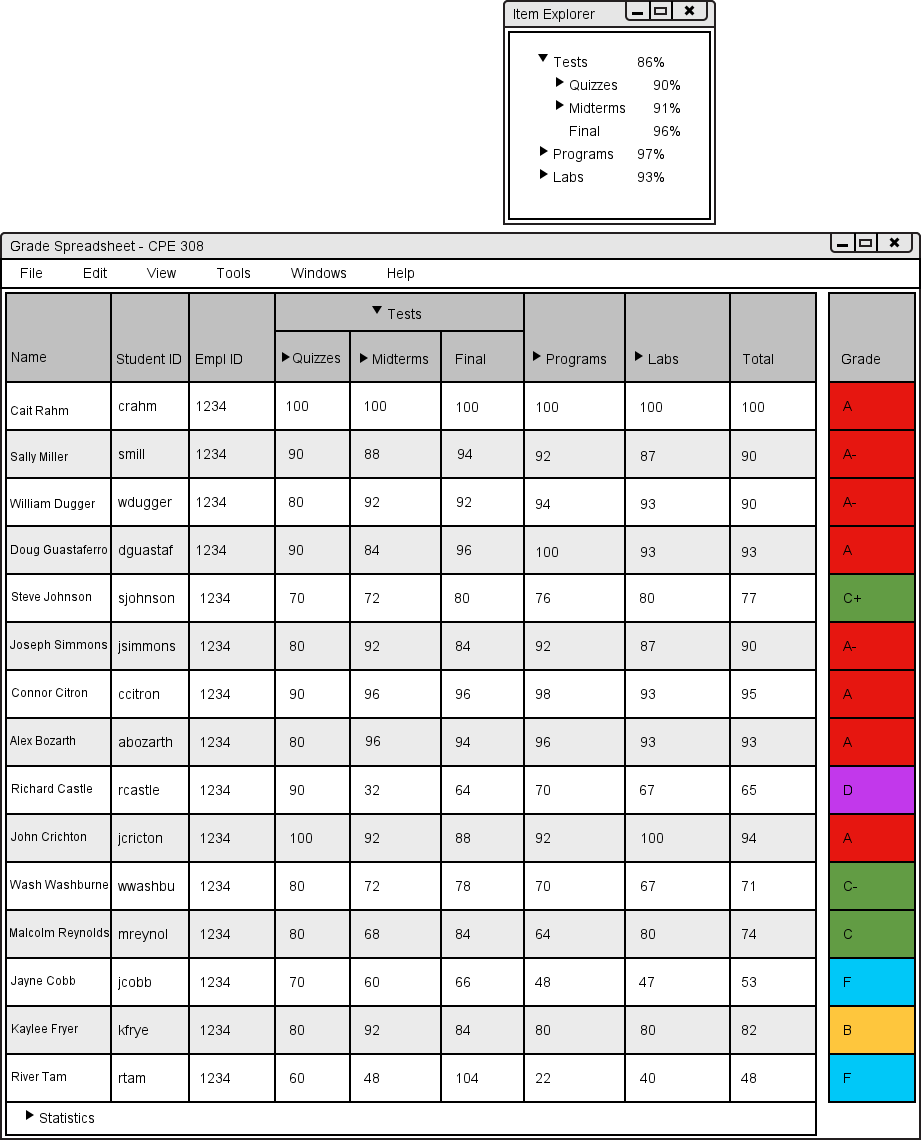
Figure 2.5.1.2: Showing Tests sub-categories.
The user then clicks the Midterms sub-category arrow, which shows M1 and M2.
The percentages shown for a student's average grade in a sub-category are not editable.
When an assignment is reached it is possible to
edit the grades. M1 and M2 are shown in Figure 2.5.1.3. Note: M2 has been created,
but not graded yet.
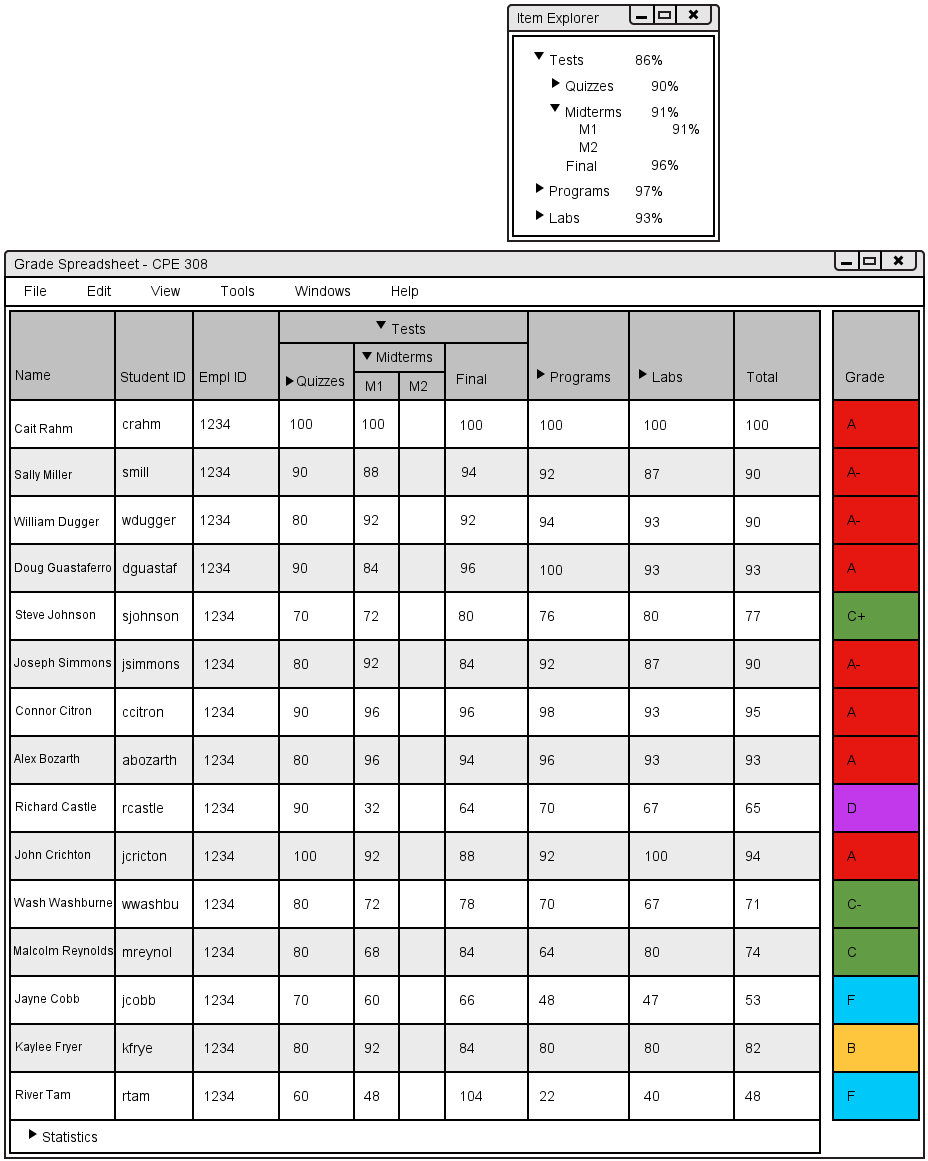
Figure 2.5.1.3: M1 and M2 are shown.
Prev: [none]
| Next: statistics
| Up: class-spreadsheet
| Top: index