This scenario shows how an individual views Statistics for their student's grades. In this scenario, we assume that the user has only the default settings and has already created 15 students (covered in section 2.3.2.), as well as setup 3 categories: Tests, Programs, and Labs. We also assume grades have been entered for each of these categories.
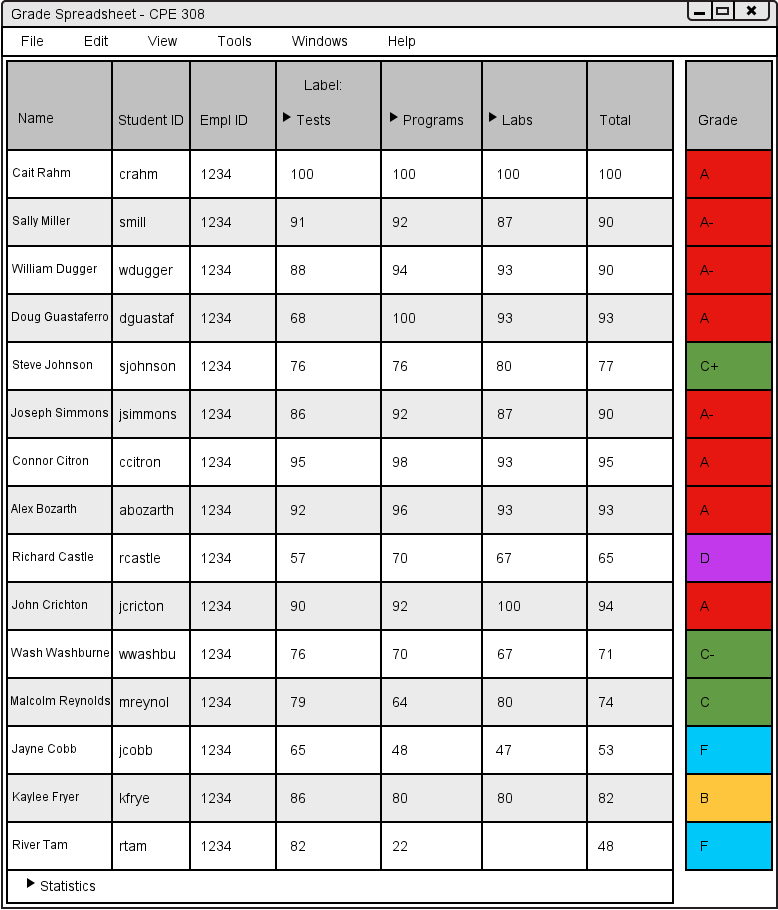
The user initially sees the Grade Spreadsheet window shown in Figure 2.5.2.1. The user clicks the arrow next to Statistics, which brings down a table
of Statistics for the assignments in the spreadsheet.
Figure 2.5.2.1: Default view of Grade Spreadsheet.
The table shows how many data points, the mean, the median, and the standard deviation. Note: the number of data points for the Labs column is 14 because the assignments for that category aren't completely graded.
The Statistics are shown in Figure 2.5.2.2.
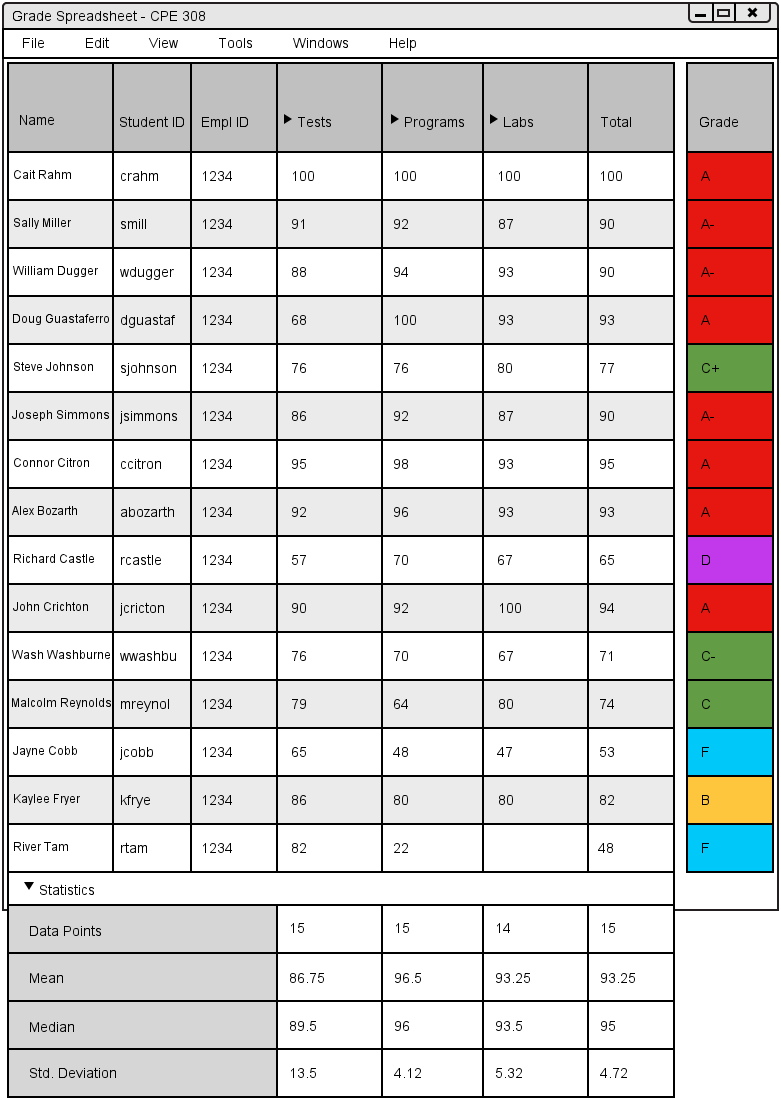
Figure 2.5.2.2: Showing the Statistics.
The user clicks the arrow next to Statistics again and the Grade Spreadsheet will return to
its default view. Shown in Figure 2.5.2.1.