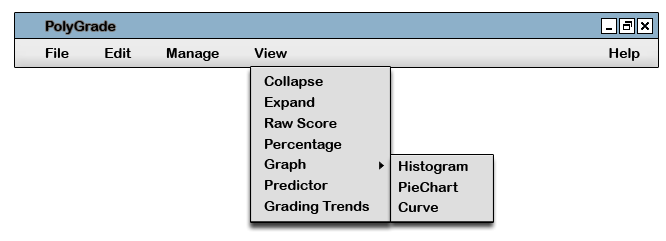
Figure 59: Selecting Graphs from the Menu Bar.
Users can select a graph to view by selecting on the Menu Bar:
'View' -> 'Graph'
A menu follows, where either Histogram or PieChart will be options.
 Figure 59: Selecting Graphs from the Menu Bar. |
GoTo: