Graph2D Screenshots
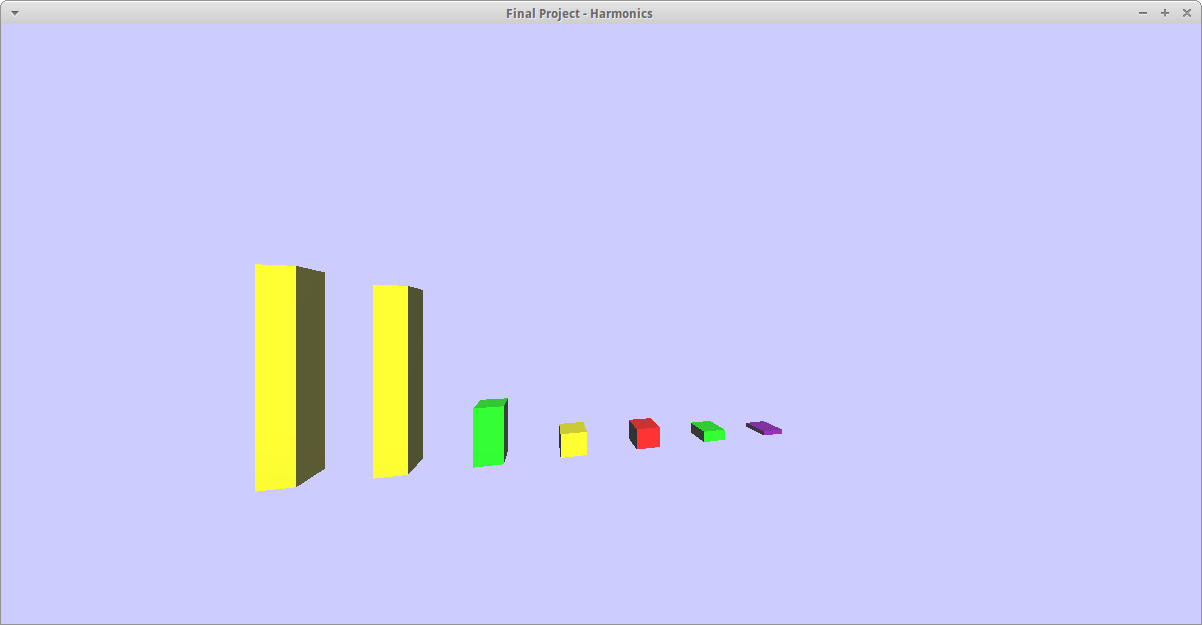
Teacher
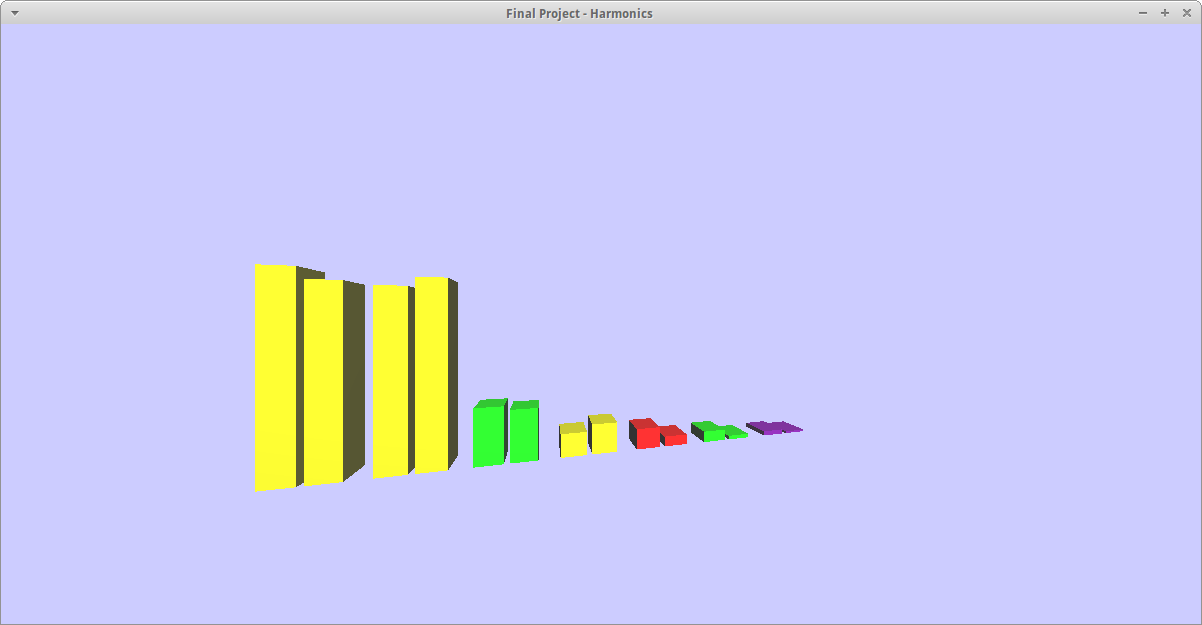
Teacher And Student
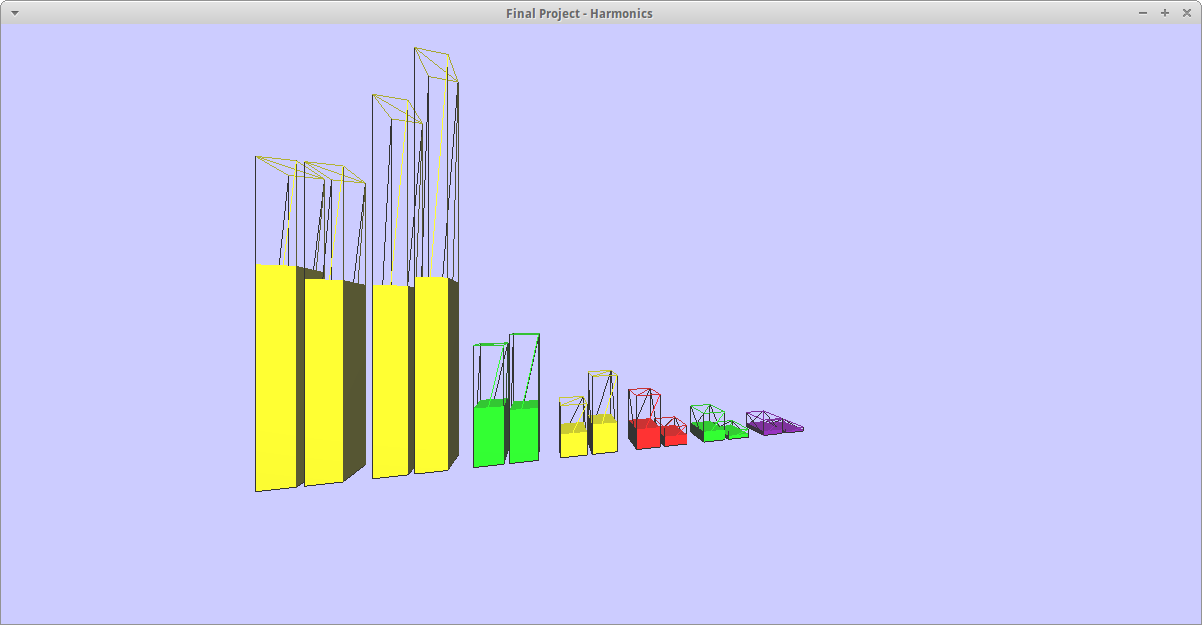
Teacher And Student With Max
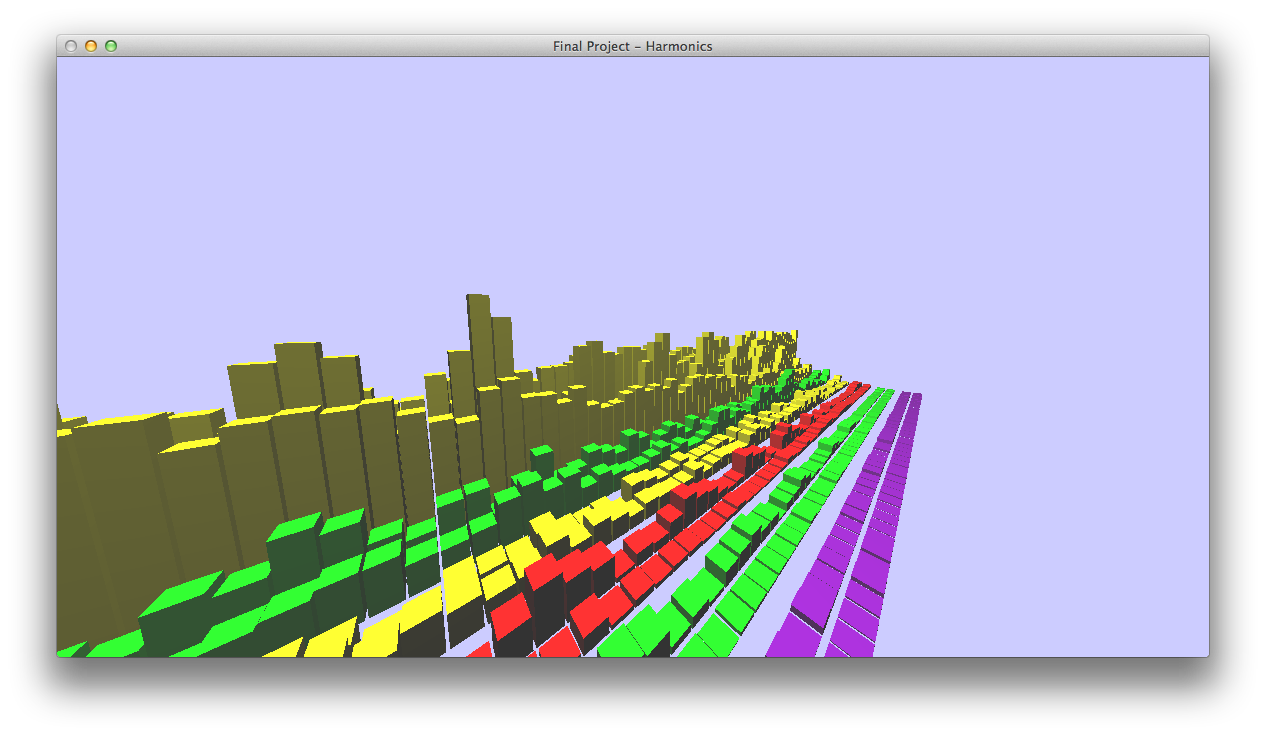
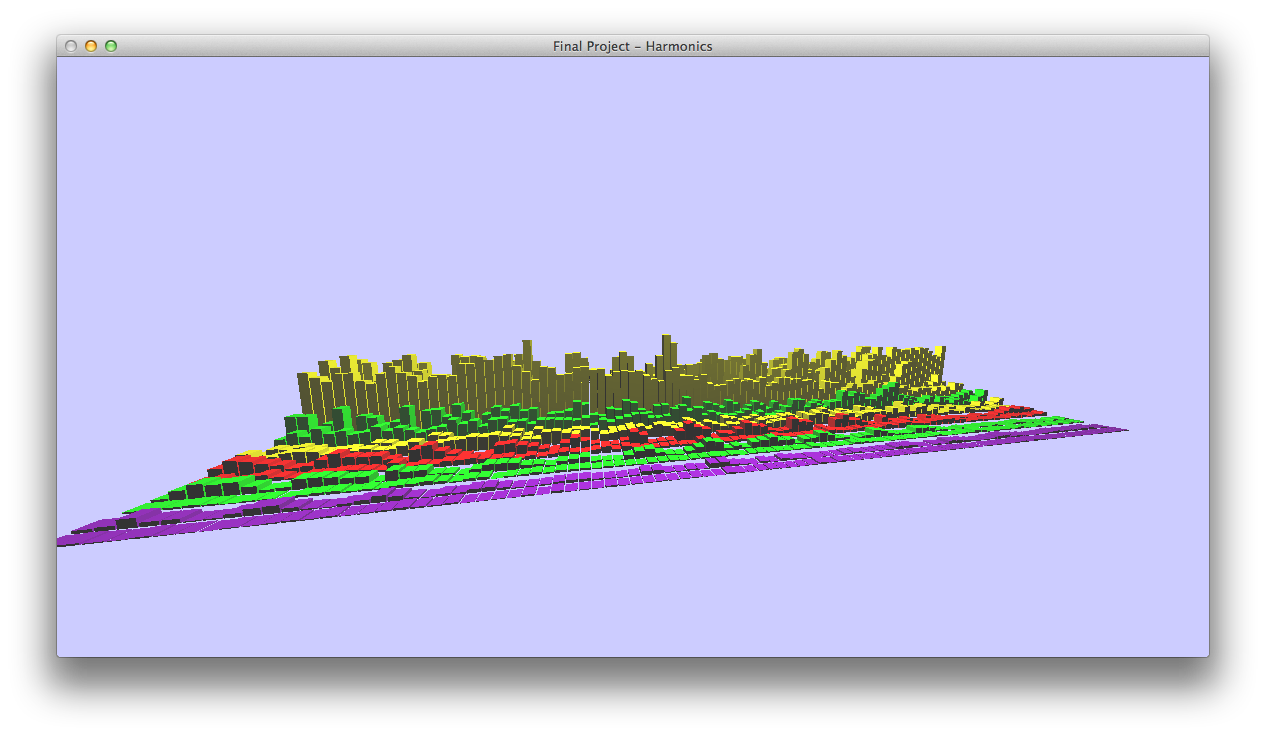
Graph3D Screenshots
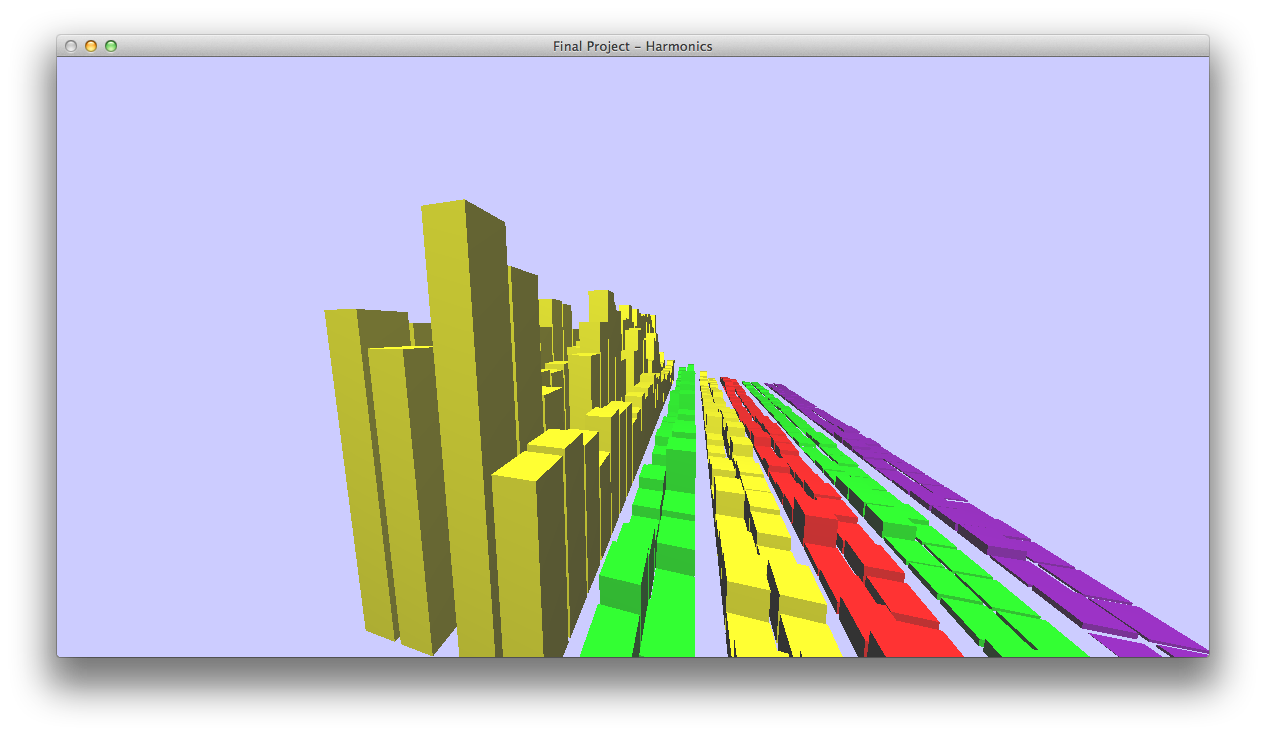
Harmonics With Z-axis As Time
Another Graph3D Image
One more Graph3D Image
Readme
Overview/Introduction
Please read the home page first for background information.
These two apps show harmonics in the traditional Real Time Analyzer (RTA)
style. Each bar represents a harmonic (left most is H1). The colors
use the same scheme as the Color app:
yellow: fundamental & octaves of the fundamental (H1, H2, H4)
green: 5ths (H3, H6)
red: 3rd (H5)
purple: 7th (H7)
The height of each bar represents the strength of that harmonic. A
linear scale is used. Some apps use a log scale, but for this
situation we're using linear. Most RTA's are strictly transient, they
only show data while a note is detected. For the graph2d app, once
the note finishes, the average remains on the screen. Optionally, the
user can also show the max for each harmonic. The ability to compare
two notes is not found on most RTA's.
The graph3d app shows the harmonics as in graph2d, but gives a time
based view. The z-axis is used to represent time. Since this is a graphics
class, I wanted to implement a flying camera, and this seemed like a
good opportunity to do so.
The files used by these two programs are:
hdata/shelly.pre2 - teacher's harmonics
hdata/misty.pre2 - student's harmonics
There are also 2 wav files with the audio of each note.
hdata/shelly.wav - teacher's audio
hdata/misty.wav - student's audio
To run the program:
make
./graph2d // press 1 for teacher, 2 for student
./graph3d
Keyboard controls for graph2d:
1 - select teach
2 - select student
i - show max harmonics value (as a wireframe along with average)
q - quit
Keyboard/mouse controls for graph3d:
wasd - standard camera movement controls
r - reset back to starting camera position
n - switch to wireframe
m - switch to solid figures
q - quit
click/drag mouse controls for camera movement
</plaintext></div></body>