Introduction
This graphics final project looks at ways to show harmonics to help musicians improve their tone. The goal is to represent visually represent measurable qualities of tone. In order for a musician to use this information, it must be presented in a manner that is easily digestible and actionable. Unlike most of the students in the CS department and other technical majors, musicians may not be accustomed to high technology and heavy data analytics. To avoid cognitive overload as the musician practices or plays simple and intuitive displays are essential.
Background
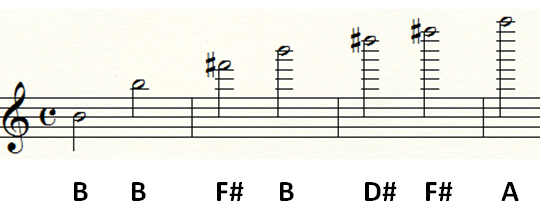
Before describing the project implementation, some background information about tone and harmonics are needed. Musical sounds are composed of a set of frequencies. We hear a note and perceive a pitch, and that pitch is the fundamental frequency (harmonic 1). There are other frequencies present that are above the fundamental. These frequencies are integer multiples of the fundamental frequency.
For example, if the fundamental is a B that oscillates at 500Hz, then the second harmonic will be at 1000Hz or 500Hz X 2. The following table shows the first 7 harmonics for B4 (the B that is in the treble cleff staff).
| Harmonic # | Note or pitch | Frequency | Graph color |
|---|---|---|---|
| 1 | Fundamental | 500Hz | Yellow |
| 2 | Octave | 1000Hz | Yellow |
| 3 | Fifth | 1500Hz | Green |
| 4 | Octave | 2000Hz | Yellow |
| 5 | Third | 2500Hz | Red |
| 6 | Fifth | 3000Hz | Green |
| 7 | Seventh (min) | 3500Hz | Purple |

Audio Examples
Play the following clip to hear harmonics extracted from a flute note. You will hear harmonics 1-7.
First 7 Harmonics
The recording was normalized so it is easy to hear each harmonic. The to hear the actual loudness of each harmonic, play this:
Adding Harmonics Together To Alter Tone
To hear how harmonics determine the quality of tone play the next clip. It starts with just the fundamental (sounds like a computer generated sine wave). Then the fundamental and harmonic 2 (H2) are played together and you can hear how this alters the character of the sound. Next, when the Fundamental + H2 + H3 are played together it starts sounding like a flute. The example continues up to H7.
Comparing The Tone of Different Musicians
Here is a recording of a student and a teacher. The tone quality difference is from the mixture and strength of harmonics.
Note
Some of the applications play a sound file. The playback is not integrated into the application. Wav file are played in a separate thread and the sound may not be synchronized with the actual graphics demo. The actual command to play the wav file (on linux) was system("aplay hdata/shelly.wav").
For screenshots and details of the apps, click on the links at the top of this page
References
- http://www.glprogramming.com/red/chapter03.html (good overall tutorial)
- https://polylearn.calpoly.edu/AY_2012-2013/pluginfile.php/337840/mod_resource/content/1/heirarchy.pdf (for hierarchical modeling)
- The Computer Music Tutorial, Curtis Roads - Chapter 12-13 (for digital signal processing and harmonics)
- http://cs.lmu.edu/~ray/notes/openglexamples (for flying camera)