Design
This project was designed to handle 8-bit and 16-bit .raw format datasets. These datasets were primarily downloaded from volvis.org and celebisoftware.com (Please see the References page for full link to these resources and others). A typical dataset from volvis.org is shown below. Figure 1 shows the description of the dataset, size of the file, dimensions of the dataset, and the bit format.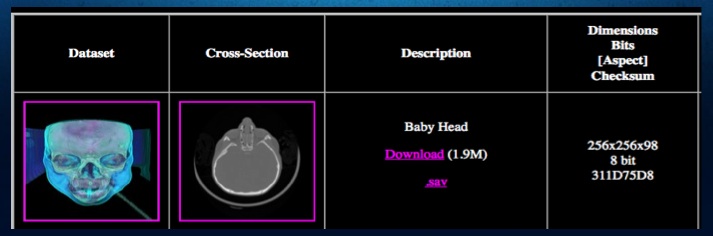
While some datasets were downloaded in .raw format, many others were in .pvm format. Data stored in .pvm format contains information about bit depth, cell spacing, grid size, dataset description, type of scanner, comments and raw data. The .raw format was chosen for this project. In order to convert from .pvm to .raw format, the utility provided by the v^3 software was used (Please see the References page for link to this software). The typical preprocess flow before uploading the .raw file to the application is shown in figure 2.
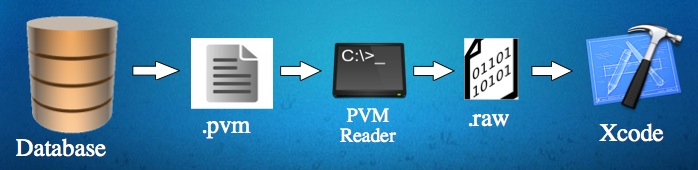
Once the .raw format file has been generated by either using the utility mentioned above or downloading it from a database, the file is then read by my application and processed as shown in figure 3.
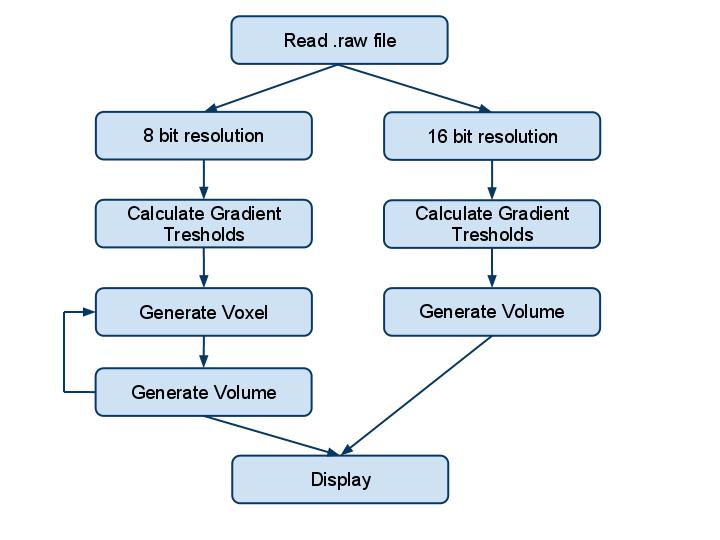
When the file is read by the application, it is processed depending on the bit data type:
1.If the data is in 8-bit format, the gradient thresholds are calculated, voxels are generated and saved in a vector container if the
value meets the threshold level, and this data is displayed according to the user's selected rendering option: Render as voxels,
Bubble Model or ray casting.
2. If the data is in 16-bit format, the gradient tresholds are calculated and a simple version of a voxel is generated and saved in
a vector container if the value meets a given treshold level and the data is displayed according to the user's rendering option.
A simple version of a voxel is used for 16-bit data since these datasets tend to be of size 512x512x512 rather than 256x256x256 as seen in must 8 bit datasets. Due to the big size difference, processing of large datasets tends to consume a lot of memory and the application is not able to allocate the memory required if the Voxel class contains many data members. Therefore, after several hours of testing and figuring out that this was happening to my application, a Voxel structure was created and used rather than a Voxel class. In addition, rather than creating a voxel that contained all 8 vertices, only 1 vertex was saved and all other Voxel class functions omitted in order to save space and be able to render 16-bit datasets.
Overall, a total of four classes were implemented:
1. Vertex class
Class that saved the (x,y,z) coordinate values as well as the normal values
2. Vector3D class
Class that saved the (x,y,z) coordinate values as well as the normal values, calculated vector magnitude, and overloaded
multiplication, adddition, and subtraction operators as well as the dot product of two vectors
3. Voxel8bit class
Class that saved all eight vertices of a voxel, the gradient magnitude, color, opacity, and normal. Set and get methods were
provided to change these values
4. Voxel16bit class
Class that saved all eight vertices of a voxel, the gradient magnitude, color, opacity, and normal. Set and get methods were
provided to change these values. This class is not used due to memory limitations.
5. main.cpp Driver
This .cpp file contains all the code to create the graphical user interface and all algorithms to process 8-bit and 16-bit
volumetric datasets and display these datasets according to the rendering option selected: Voxels, Bubble Model, and Ray
Casting
Using the classes mentioned above, the data saved and stored in the vector container was extracted and displayed according to the Algorithms section of this website.
In order to make the rendering interactive, a GUI using GLUI library was created as shown in figure 4.
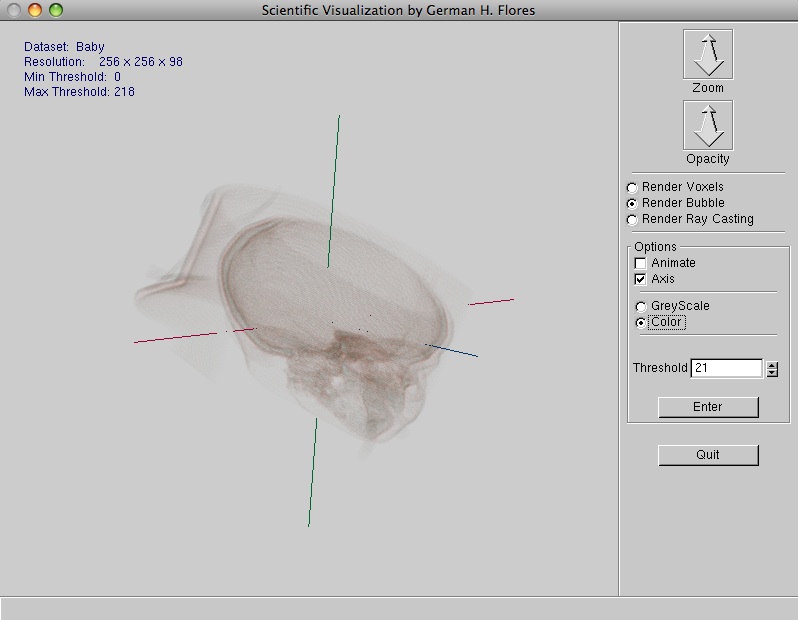
As shown in figure 4, the following options are allowed to be changed by the user:
1. Zoom: zoom in and out to make the volume rendered bigger or smaller
2. Opacity: Increase or decrease the opacity value to make the surfaces darker or lighter
3. Select the type of rendering: Voxel, Bubble model, or ray casting
4. Animate the volume by having it rotate along the y axis
5. Show x,y,z, axis
6. Display the volume as greyscale or color
7. Change the threshold value to add or remove iso-surfaces. The min and max threshold values are displayed
The dataset resolution, dataset name, minimum and maximum allowed threshold values calculated by gradient magnitudes are shown in the upper right corner of the application using Bitmap characters.