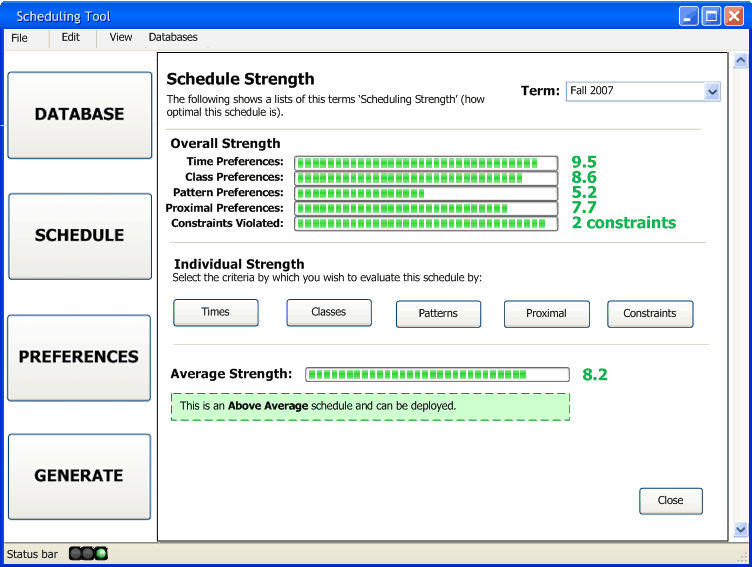
After the scheduler has generated a schedule, one of the things that they are able to check is how good of a schedule was generated. For example, they may want to see how many instructors had all their preferences met, which instructors got poorly optimized schedules and the average strength of a given schedule. All of this information will be available in the Schedule Strength interface.

Figure 2.5.3.1: The Scheduling Strength Interface
The above interface allows the scheduler to view the strength of the generated schedule. The main interface shows the averages of each of the preference strengths, that is, how close to optimal they were on a scale from 1 to 10 (1 being poor, 10 being perfect). Additionally, the scheduler can see how many constraints were violated (the lower the number, the better). This interface shows a quick snapshot of the schedule optimality and allows the scheduler to make a quick decision about whether the schedule is acceptable or not.
If the scheduler would like to see more in-depth strength information on the individual preferences, they can click on one of the buttons under Individual Strength.